If you’re looking to grow your business in 2019, then this article is for you.
I believe that looking back at the end of the year can help transform how successful you’ll be in the next year. Many businesses undergo quarterly reviews, but some only review their last quarter of the year to save time. I urge you to review your full year, as it’s easier to spot trends over a longer timeline.
Preparing for your review
Before you start diving into stats and analyses, it’s important to identify the intention for your review.
- What do you want to learn, and why?
- Are you wanting to improve your marketing?
- Improve productivity?
- Find efficiencies?
Answering these questions will give purpose to your evaluation.
Where to Begin
When it comes to marketing reviews, I’d suggest looking at these 3 main areas:
- Google Analytics
- Social Media
- Lead Conversions
Google Analytics
I’ll assume you have Google Analytics set up on your website. If not, check out this guide.
There’s a lot of data in Google Analytics, and it can get overwhelming fast. The key items to evaluate when reviewing your analytics are:
- Performance of your marketing campaigns
- Your overall traffic growth.
- Your bounce rate
Performance of Marketing Campaigns
Follow these steps to review your marketing campaigns:
- First, identify the time periods during the year where you ran a marketing campaign. Maybe it was an Adwords Campaign, SEO campaign, or maybe email newsletter campaigns
- Go to Acquisition->All Traffic->Channels, and choose the date range of your campaign, and check off “Compare to previous period”.
- Your results will you show you stats during your campaign and the same period of time before your campaign. If you don’t feel this is a good comparison, you can also compare to last year’s stats. Do this for each identified campaign

- Evaluate each campaign to determine whether it met the result you wanted. Did the campaign generate the traffic you were expecting?
- If you set any ‘Goals’ within analytics for those campaigns, review the results of these goals. If you need help setting goals, check this out: https://support.google.com/analytics/answer/1032415?hl=en
After you’ve reviewed each of your campaigns, determine which ones yielded the best results and which ones aren’t worth doing again.
PRO TIP: Evaluate every campaign as soon as it’s done to save time at the end of the year!
Traffic Growth
Next is your overall traffic growth. You can read this information month by month, or as a full year. Let’s walk through a full year analysis:
- Within your analytics account, go to Acquisition->All Traffic->Channels
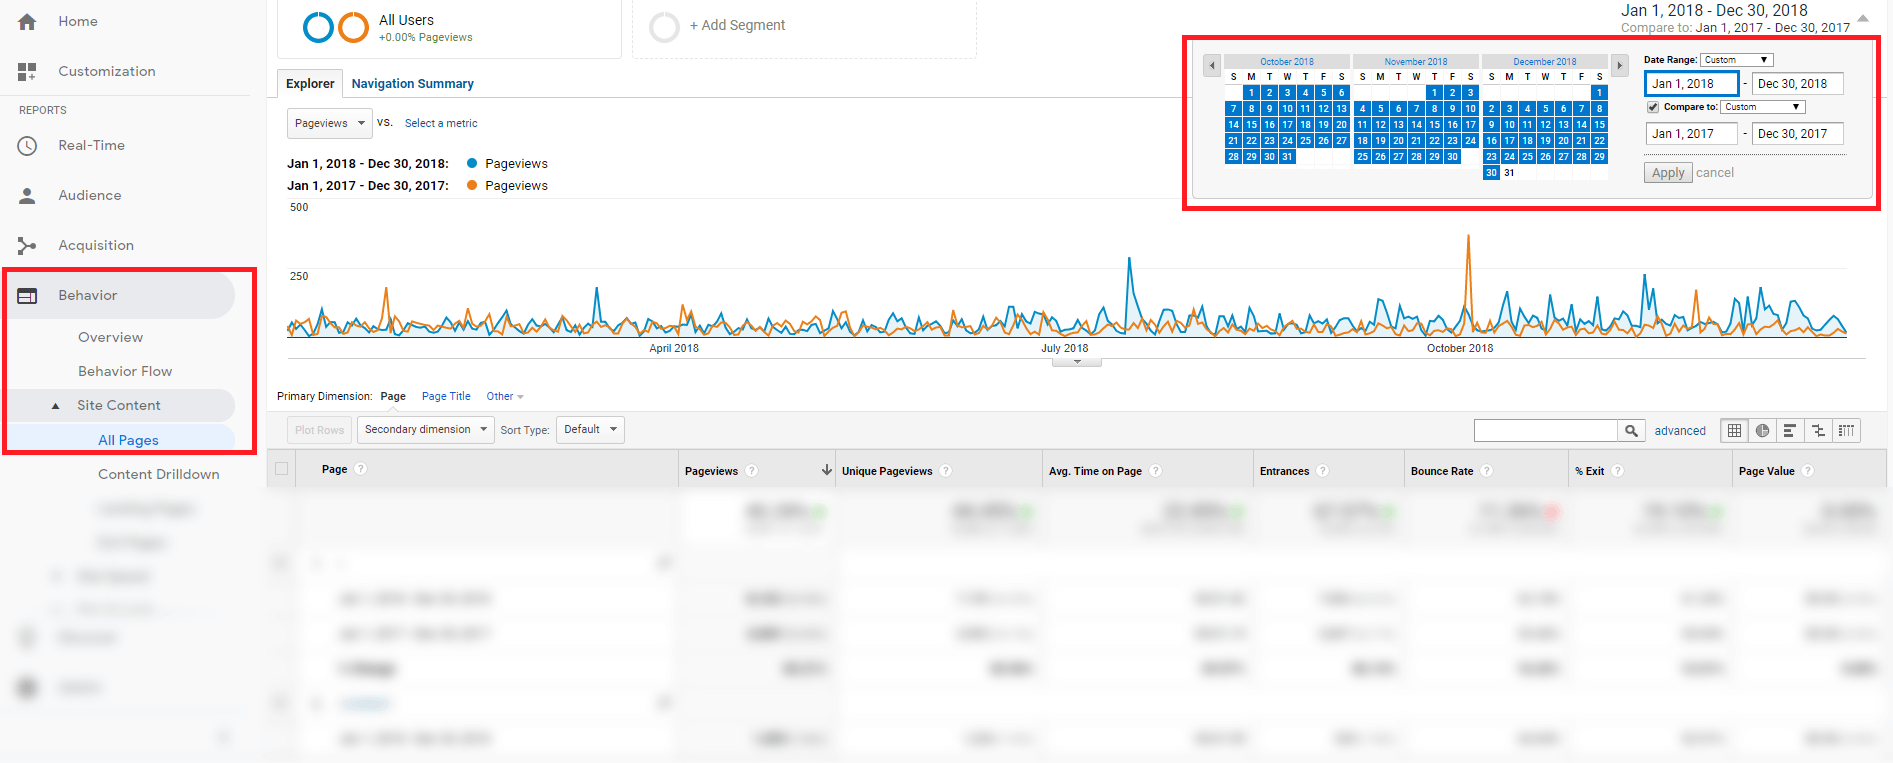
- Edit the date fields in the top right corner to be Jan 1 to today’s date and check off ‘Compare to Last Year’.
- You’ll be able to see a percentage of growth for each of your traffic channels including direct, organic search, referral, social, paid search and others. This will give you an idea of which channels you’ve seen improvement on and which ones need more attention.
- You can also review what pages on your site have been most popular or grown in traffic by doing the same date comparison on Behavior->Site Content->All Pages

Traffic analysis is a great way to see if your marketing is improving or not. Your website is the hub of your marketing wheel, so improving website traffic is a definite must.
Bounce Rate
In technical terms, Google’s bounce rate measures any session that begins and ends without triggering more than one request to analytics. In other words, this is how many people get to your website and leave without interacting with it.
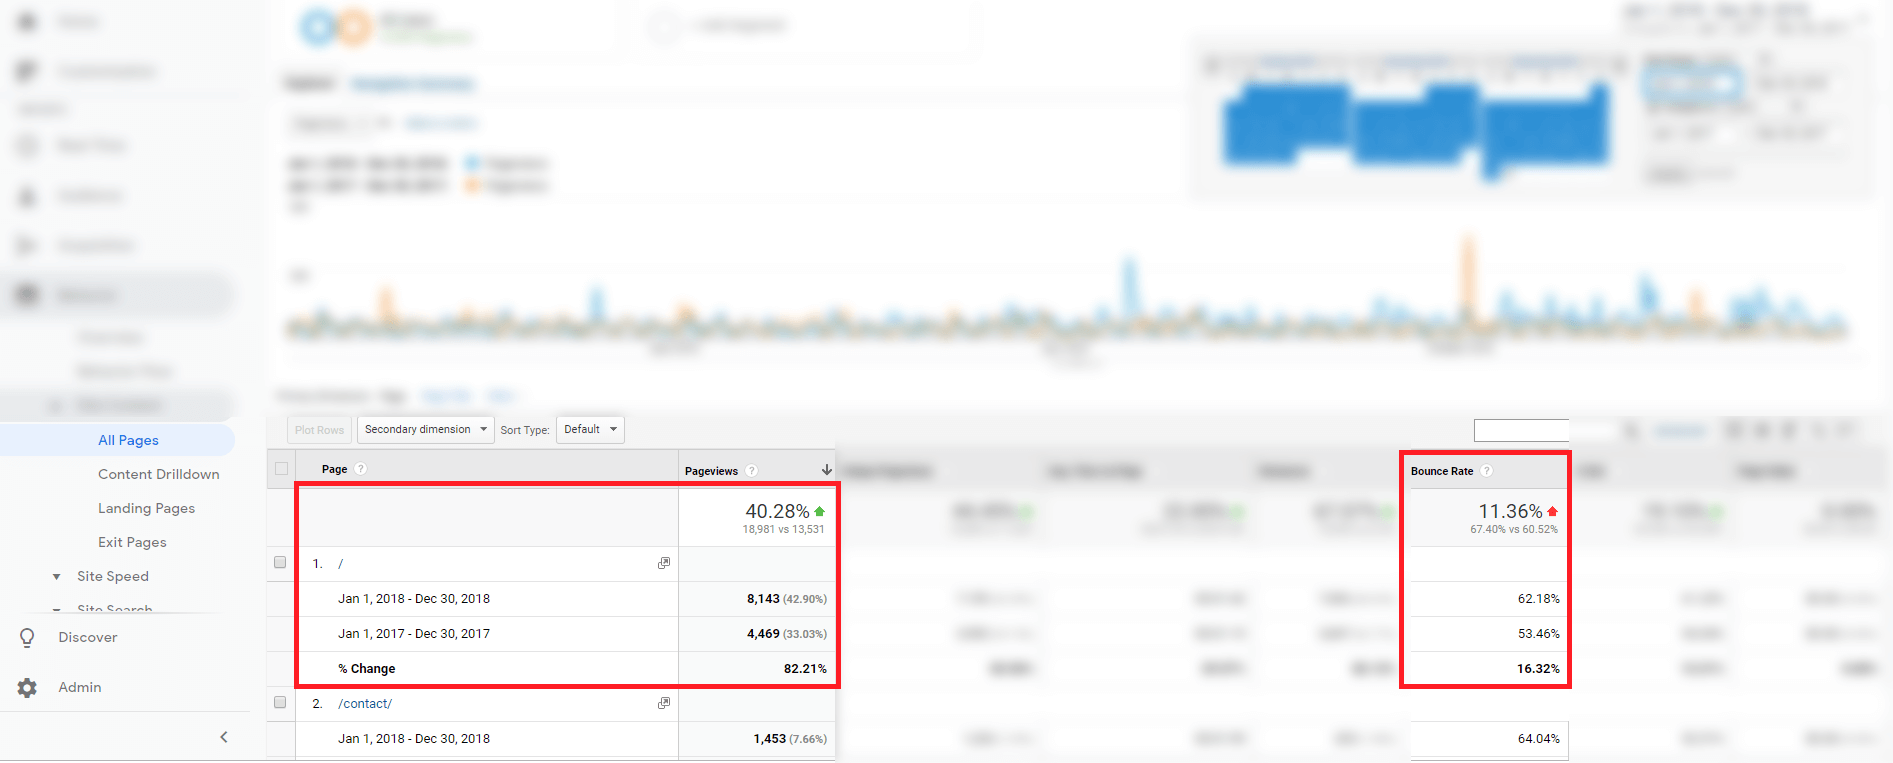
The best way to get a real idea of your bounce rate is to return to the pages overview and focus on the sections depicted in the following image:

I’ll give an example analysis of our own website’s bounce rate: It’s clear that we’re seeing an increase from last year (a bad thing), but a glance at the information right below that shows me that the rate from our home page has decreased considerably (a good thing). Here’s what has changed:
- We launched a new website
- Our page views have increased
- Our new website has many more pages than the old one
- Customers are landing directly on some of our inner pages due to ads, referral traffic, social media, etc.
Over all, this tells us that we’ve been doing great work catering to our viewers that land on the home page, but that we can work on making our interior pages more interactive.

Social Media
To find out which posts are most popular on your Facebook page, follow these steps:
- Log into Facebook and open your Pages Manager
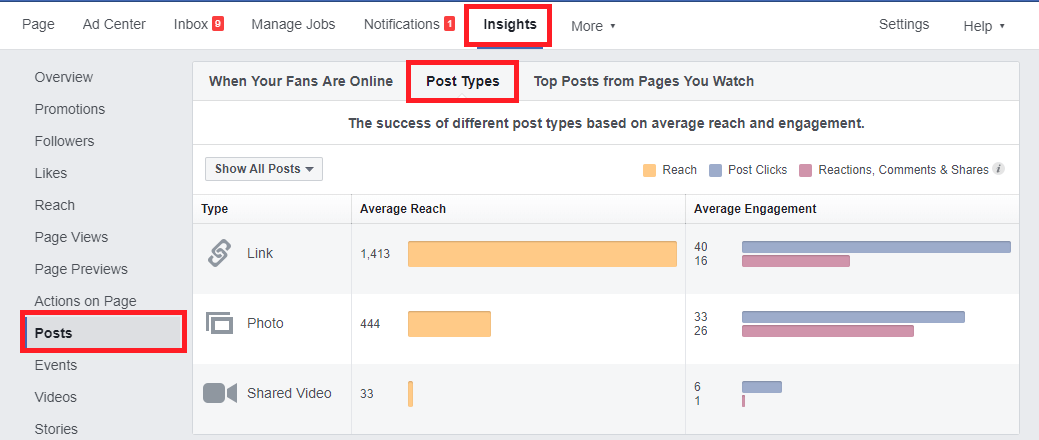
- Once you’ve opened your Page, go to the Insights tab
- On the left, click on Posts
- Along the top, click Post Types
- At the top you’ll see each Post type with their average reach and average engagement
- Under this will be stats on each post
- Go through your list of posts to determine which ones performed the best, and which ones had no engagement

If you ran any paid marketing campaigns within Facebook, you can also review your Promotions tab under Insights.
Other Channels
If you also use Instagram, Twitter, LinkedIn or Youtube in your business, you can follow a similar strategy to find out what has been most popular on those channels.
Look for trends and try to identify what has worked for you in the past. Social media is always changing, so try to stay up-to-date throughout the year.
Lead Conversions
There are two main components to tracking lead conversion. The first is generating the lead, and the second is converting that lead into a paying client.
One way we track lead generation is by using goals in Google Analytics to determine what percentage of traffic complete one of our online forms. We must manipulate this data a bit because no matter how good our spam protection is, bots or spammers find a way to fill out our forms, too.
All leads that come in, whether they completed a form on our website or called us, are tracked in a tool we use called Trello. We have lists within Trello to follow each lead through the conversion funnel. This can then help us determine how many of our leads are converting into paying clients.
There are many lead tracking tools known as CRMs, and every business seems to do it a little differently. However you track your leads and conversions, make sure you evaluate the data to make sure you’re always improving.
Now What?
Now that you know what to do, go set yourself some goals. You’ve reviewed your data from last year, now go use that to set goals and strategies to have even a better year in 2019.
While you’re at it, kick off the new year with a bang by taking advantage of some of the digital marketing services we offer here at Yas.


